Your Incident Stack Does Not Need Another Dashboard. It Needs an Intelligence Layer.
An agentic triage layer that ingests signals, gathers context, correlates related events, classifies the incident, judges impact and routes it to the right team, with the evidence attached.

Key takeaways
- Triage is a context problem, not a routing problem. The alert almost never carries enough to decide with.
- Classification before enrichment and correlation is guesswork. The order of the steps is the architecture.
- Deterministic policy keeps the guarantees: ownership from the CMDB, fixed escalation, human approval on consequential actions.
- Every ingested signal is untrusted input. An attacker who can write to a log can try to triage their own intrusion.
- The metric that matters is the false negative, not accuracy.
- The workflow owns the order of events. Individual steps can be functions, model calls or agents, chosen per step rather than for the whole system.
Modern engineering organisations do not suffer from a lack of signals. They suffer from too many disconnected ones.
A production service starts returning errors. An observability platform fires an alert. A security system flags suspicious traffic. A customer reports that checkout is failing. A deployment went out ten minutes ago. An infrastructure monitor reports database saturation.
Within minutes there are five alerts, two tickets, a Slack thread, and several teams trying to answer the same questions. What is actually happening? Are these related? How bad is it? Is this security, reliability or application? Who owns it?
And that is a context problem.
The routing problem is harder than it looks
Most large engineering organisations already have specialised teams for different classes of incident: security incident response, SRE, platform, infrastructure, application engineering, networking, data, product, support.
The trouble is that an alert rarely arrives with a clean organisational label. Take checkout-api 5xx error rate > 15%. At first glance that is an application incident. Then add the surrounding minutes.
13:02  checkout-api v4.18.2 deployed
13:07  authentication failures increase
13:09  database connection utilisation reaches 92%
13:10  checkout latency increases
13:11  WAF reports unusual request volume
13:12  payment timeouts increase
13:14  customer reports checkout failure
What is it now? A deployment regression, a database problem, an authentication failure, malicious traffic, or a payment dependency? Possibly several at once.
Traditional routing often decides based on whichever alert arrived first. An experienced engineer does something different: they gather evidence before deciding. That gap is where an agentic system earns its place.
Traditional routing starts with rules
Most incident routing looks roughly like this: an alert hits a rule engine, which matches on service, keyword or severity, and hands it to a resolver team.
Those rules are useful. They are predictable and easy to reason about. But real incidents do not respect organisational taxonomies. A database alert can be caused by an application deployment. An authentication failure can be a bug or an attack. Twenty alerts can be one underlying fault. A low-severity infrastructure warning can matter enormously if the affected service takes payments.
So the question is not which rule matches this alert. It is this:
Answering that is not routing. It is triage.
The missing layer in the incident stack
Large organisations already have most of the pieces: observability, SIEM, logs, APM, cloud monitoring, ticketing, on-call, a CMDB, deployment systems, threat intelligence, runbooks, Slack.
The opportunity is not to replace any of that. It is to put a reasoning layer between the systems producing signals and the teams who have to act on them.
- Observability
- SIEM
- Logs
- Cloud alerts
- User reports
- ITSM
- Deployments
- Ingest
- Enrich
- Correlate
- Classify
- Prioritise
- Route
- Assist
Why not just use an LLM classifier?
The obvious first attempt is alert in, model, team out. That handles the easy cases and misses the hard part: the alert rarely contains enough information to decide.
A classifier can only reason over what it is given. If it does not know that a deployment landed five minutes earlier, that three related services are failing, that the same error occurred two months ago, that this service belongs to a particular team, or that a security signal appeared in parallel, then its answer is sophisticated keyword matching.
- Related alerts
- Recent deployments
- Service ownership
- Security signals
- Similar incidents
The order matters. Classification before context is guesswork. Correlation usually belongs before severity. Routing should wait until ownership and confidence are both understood.
One incident, end to end: ingest, enrich, correlate, classify, prioritise, route, assist
The sequence matters more than any single step. What follows is one incident, start to finish.
Ingest the signal
Say the incident opens with this.
{
  "source": "observability",
  "service": "checkout-api",
  "alert_type": "high_5xx_rate",
  "error_rate": 14.7,
  "timestamp": "2026-10-02T18:32:00Z"
}
That is an observation, not a diagnosis. The first job is to normalise incoming signals into one representation, because different tools describe the same thing differently: a Datadog service, a CloudWatch resource, and a customer saying “checkout is failing” are the same subject in three vocabularies.
Normalisation is what gives every later step a consistent state to reason over.
Enrich with context
The next question is what else we should know before deciding anything. The agent pulls from connected systems: recent logs, service ownership, deployments, infrastructure metrics, dependency health, open incidents, security signals, past incidents, runbooks, customer reports.
It should not retrieve everything. It should retrieve what bears on the current hypothesis.
Correlate related signals
Now the system is looking at five things inside four minutes: database saturation, a checkout 5xx spike, checkout latency, payment timeouts, and a customer report.
A naive system opens five incidents. A triage layer asks whether these are five problems or five views of one.
Correlation can weigh time proximity, service dependencies, shared infrastructure, deployment history, error signatures, affected resources, request traces and historical patterns.
Incident #4821

Primary symptom
  Checkout API failures

Correlated signals
  Database saturation
  Checkout latency
  Payment timeouts
  Customer report

Likely shared context
  checkout-api deployment v4.18.2
That alone removes a lot of duplicated investigation. Instead of five teams chasing five alerts, there is one incident with one context.
Classify the incident
Only now does classification mean anything.
{
  "incident_category": "production_regression",
  "primary_domain": "application",
  "affected_service": "checkout-api",
  "suspected_trigger": "deployment_v4.18.2",
  "security_indicators_detected": false
}
This matters because incidents cross boundaries. An authentication failure can look operational until the agent finds thousands of failures from hundreds of source IPs with credential-reuse patterns and no recent auth deployment, at which point it is a security event. Or the reverse: the same symptom, but the auth service shipped three minutes ago with new token validation, and it is a regression.
Same symptom, different classification, decided by context rather than by keyword.
Prioritise on impact, not alert severity
A monitoring tool might label something medium. But the affected service may handle checkout for the whole business.
Severity should be informed by customer impact, service criticality, blast radius, security implications, duration, dependency impact, revenue exposure and history.
{
  "recommended_severity": "SEV-2",
  "evidence": [
    "Checkout is customer-facing",
    "Error rate reached 14.7%",
    "Payment timeouts are also increasing",
    "Customer reports confirm user impact",
    "Began shortly after deployment v4.18.2"
  ]
}Route on ownership and context
Only now is there enough evidence to suggest an owner. Rather than “database alert goes to the database team”, the recommendation can carry nuance.
Primary owner
  Checkout Application Team

Secondary collaborator
  Database Platform Team

Suggested SRE involvement
  Yes, if error rate stays above 10%

Security escalation
  No supporting evidence found
Ownership itself can stay deterministic: checkout-api maps to the checkout team in the CMDB, and that mapping should not be guessed at. What the agent contributes is working out whether that service is actually where the incident originates.
Explain the decision
A triage system should never answer only “route to checkout team”. The engineer picking it up needs to know why.
That is an investigation starting point rather than another alert.
The incident state should evolve
It helps to think of this as one incident state that keeps getting richer, rather than a series of isolated prompts.
// on arrival
{ "service": "checkout-api", "error_rate": 14.7 }

// after enrichment
{ "service": "checkout-api", "error_rate": 14.7,
  "recent_deployment": "v4.18.2", "database_saturation": true,
  "payment_timeouts": true, "customer_impact": true }

// after correlation
{ "incident_id": "INC-4821",
  "signals": ["checkout_5xx", "database_saturation",
              "payment_timeout", "customer_report"] }

// after classification
{ "incident_type": "production_regression",
  "suspected_trigger": "deployment",
  "recommended_owner": "checkout_team",
  "recommended_severity": "SEV-2" }
That accumulated state becomes the shared context for the rest of the incident.
Good agents know when they do not know
A triage step should not always produce a confident answer. Suppose it sees mass authentication failures, unusual traffic, and a recent authentication deployment. There are at least two plausible stories: an application regression, or a credential attack.
The right response is to say so, and to name what is missing: source-IP distribution, WAF activity, the failure reason, user-agent distribution, the deployment diff. Then go and get it.
Where control sits: fixed rules and confidence gates
Agentic does not mean replacing every rule with a model. Plenty of incident policy should stay fixed: a confirmed credential compromise goes to the security workflow, a SEV-1 pages the incident commander, a production database deletion requires human approval, and service ownership comes from the CMDB.
Confidence should control autonomy
Not every incident needs the same amount of human involvement. A workable policy model scales involvement to confidence and consequence.
High confidence, low consequence
Medium confidence
Low confidence
High impact or security
This gets more important if the layer ever gains the ability to act: roll back a deployment, block traffic, disable credentials, restart infrastructure, change routing, open incidents, trigger remediation. The more consequential the action, the stronger the control plane has to be, and the more carefully you have to think about who gets to influence the reasoning behind it.
Every signal is untrusted input
This is the part a security reviewer will reach first, and it is the one genuinely new risk this design adds over rule-based routing.
Look at what the layer ingests: log lines, WAF events, user-agent strings, error messages, support tickets, commit messages. An attacker influences a great deal of that text. Which means that if someone can get a string into a log your triage workflow reads, they can try to argue with it.
A regex cannot be talked out of matching. A reasoning layer can. That trade is worth making, but only with the boundary drawn explicitly.
The rules that follow
- Signal content informs the hypothesis. It never changes policy. Retrieved text is evidence to reason over, not instructions to follow. Severity floors, escalation rules and ownership mappings live outside anything the model reads.
- The policy engine does not read model output as prose. It receives a structured recommendation with a fixed schema and applies its own rules to it. A free-text field cannot become a command.
- Security classification is one-way. The agent can escalate an incident into security review. It cannot de-escalate out of one. Only a deterministic rule or a person can do that.
- Retrieval credentials are read-only and scoped. The context-gathering step needs to read logs, deployments and the CMDB. It does not need the ability to write to any of them. Anything that acts goes through a separate, gated path with its own credentials.
- Correlation is attackable too. Someone who can generate noise can try to bury a real signal inside it, or split one incident into many. Correlation confidence should be visible, not implied.
- Suppression is an event worth alerting on. If the layer ever downgrades or closes something automatically, that decision deserves the same scrutiny as the incident it dismissed.
Untrusted
Trusted
And the platform itself
A triage layer sees more of your estate than almost anything else you run. It reads production logs, deployment history, your service catalogue and your security signals, all in one place. That concentration is the point, and it is also the reason a security review will ask where the data goes, what the model provider receives, how long anything is retained, whether it runs in your own environment, what credentials the agent holds, and what an attacker gets if they compromise the layer rather than the systems behind it.
Those are fair questions and they should be answered before the first production signal is connected, not after. Securing the incidents and securing the thing that reads them are two separate pieces of work.
The metric that matters
For triage, the number to care about is not accuracy. It is the false negative: the incident the system confidently called routine. A layer that is right ninety-five per cent of the time and quietly wrong about the other five is worse than no layer at all if nobody knows which five.
That is the argument for keeping confidence visible, keeping the evidence attached, keeping security classification one-way, and keeping a human on anything consequential. Not because the model is untrustworthy, but because the cost of the rare mistake is asymmetric.
Routing is only half the value
Having gathered all that context, the system should not throw it away at the moment of handoff. The incident package can carry the summary, affected services, correlated alerts, likely category, recommended severity, recent deployments, relevant logs, the owner, similar past incidents, the runbook, what is still missing, and suggested next checks.
Instead of receiving checkout-api 5xx threshold exceeded, the on-call engineer receives this:
That changes the first ten minutes of the response, and in production incidents the first ten minutes are the ones that count.
Past incidents and runbooks become retrievable context
Incident systems hold an enormous amount of useful history that is rarely reused. Resolved tickets become an archive rather than a memory.
Given a current context of checkout-api, connection pool exhaustion, after a deployment, with payment timeouts, the layer can search what happened before and surface incident #3917: the same symptoms, triggered by a checkout deployment, root-caused to a connection-pool configuration regression, resolved by rollback, owned by the checkout platform team.
The agent should not assume the two incidents share a cause. Surfacing the similarity and letting the responder judge is the useful behaviour.
Runbooks become retrievable context
Runbooks live in Confluence, Notion, GitHub, internal docs, wikis and PDFs, and they help only if somebody already knows which one to look for.
The workflow can retrieve the right one from the incident state rather than from a search box. Checkout plus database connection exhaustion points at the connection-pool saturation runbook, and its steps can come through as suggested next checks: compare active connections with the limit, inspect the pool configuration, diff it against the previous deployment, review the rollback conditions.
At that point the system is not routing the incident. It is helping start the investigation.
The reasoning needs its own observability
Once AI takes part in incident response, there are two things to observe: the production incident, and the reasoning that triaged it.
For any decision you should be able to answer what triggered the workflow, which systems were queried, which logs came back, which past incidents were considered similar, which evidence drove the classification, why that severity was recommended, why that team was chosen, how confident the system was, whether a deterministic policy overrode it, and whether a human changed it.
Without that, the triage layer becomes one more opaque component inside an already complicated stack. Traceability belongs in the architecture from the start, not after the first disputed call.
Keep it modular
Avoid collapsing the whole thing into one enormous reasoning step. The architecture is far easier to reason about when the responsibilities are separate: normalise, gather context, correlate, classify, assess severity, resolve ownership, gate on policy and confidence, route, summarise.
Context gathering is itself several tools rather than one.
Building this with Xpectrum
In Xpectrum, you build this in the Workflow app.
What the canvas gives you is a vocabulary rather than a template: a trigger, steps that fetch, steps that reason, branches that route, and a gate before anything consequential happens. A step can be as plain as a function or as open-ended as an agent with its own tools, depending on what that step actually has to work out.
The arrangement is yours. Your context sources, team boundaries and escalation policy are not ours, so the real work is sitting with the canvas and adding, removing and rewiring nodes until the workflow matches how your organisation already handles incidents. The advantage of doing that here rather than inside a prompt is that every step stays visible: you can run one on its own, read exactly what it did, and change it without disturbing the rest.
- Observability
- Logs
- Deployments
- CMDB
- SIEM
- Past incidents
- Runbooks
Here is one arrangement of it on the canvas. It is worth saying plainly that this is an overview, built to show the shape rather than to be copied.
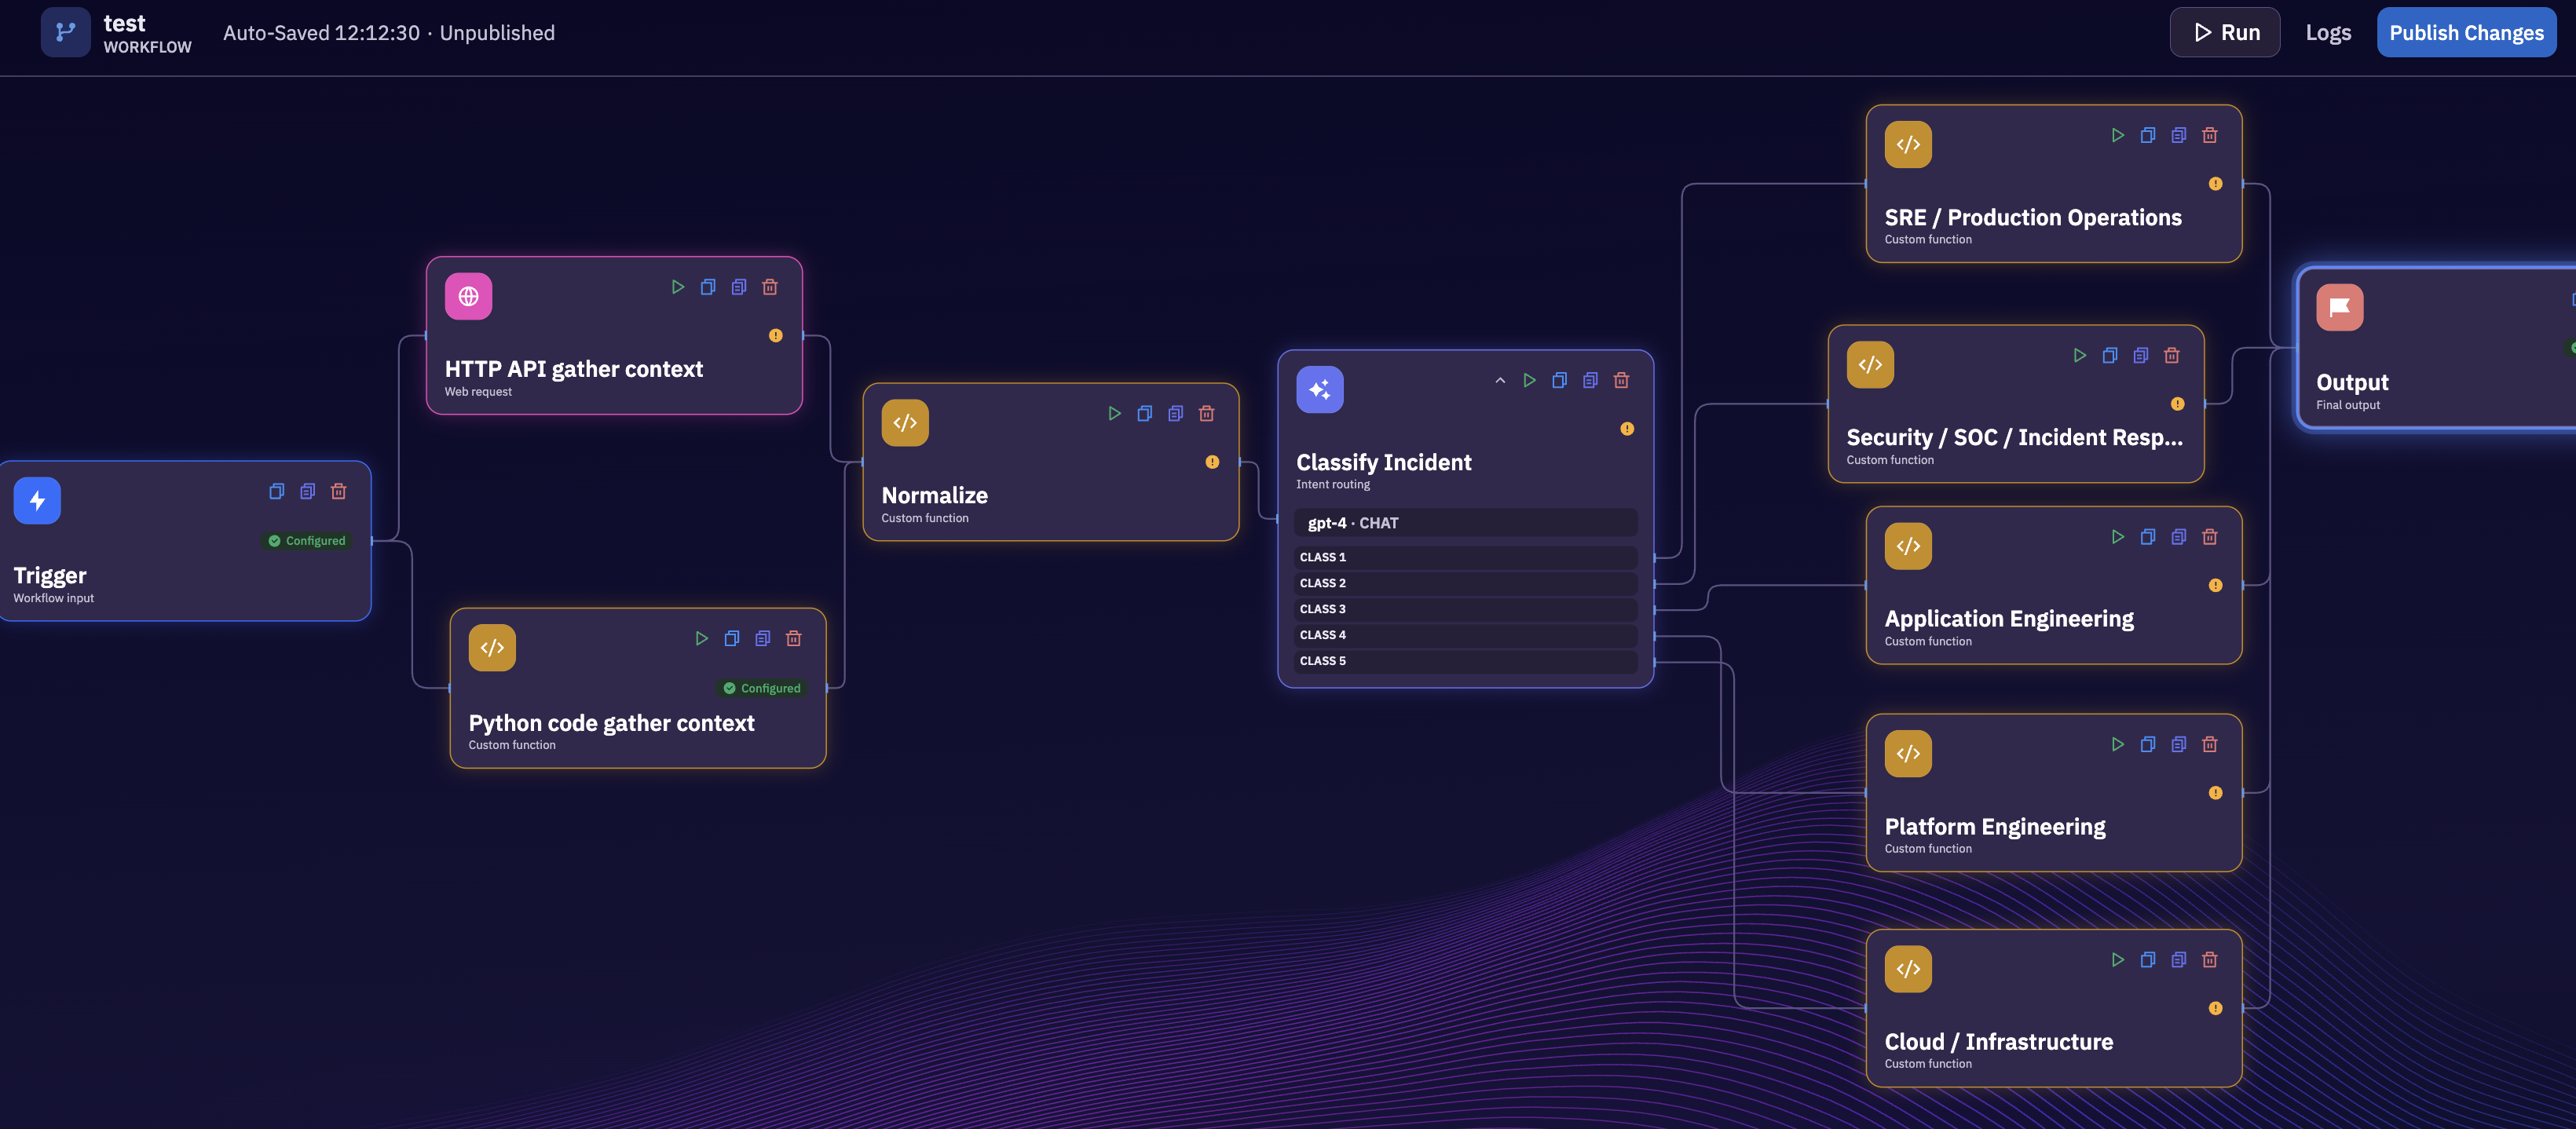
Even so, three things in it are worth pointing at, because they hold whatever you build on top.
Context gathering is parallel, and it is ordinary code
The trigger fans out to two steps at once: an HTTP request to one system, and a Python function doing whatever the others need. Neither is a model deciding what to fetch. They run every time, they run together, and if one of them is slow or broken you can see which. The reasoning happens after the evidence is in, not instead of collecting it.
The reasoning is one step, because that is all this needs
Everything converges on Normalize, and from there into Classify Incident: one model call, doing intent routing into a fixed set of classes. Classification into five known categories does not need an agent, so it does not get one.
A different incident path might. A step that has to investigate open-endedly, where you cannot say in advance which systems it will need or how many times it will look, is a good place for an agent node with its own tools. The workflow still owns what happens before and after it, and still owns the gate it has to pass through. That is the composition: fixed where the answer is known, open where it is not.
Routing is a mapping, not a decision
Each class leads to its own branch: SRE and production operations, security and SOC, application engineering, platform engineering, cloud and infrastructure. The model picks a class. The workflow owns what that class means. Changing which team handles an incident type is editing a branch, not retraining or re-prompting anything, and the five paths converge on one output so every incident leaves in the same shape.
The header matters too. It is saved, versioned, unpublished until you publish it, and it has Run and Logs next to it. You can execute it against a past incident and read what every step did. That is a different kind of object from a prompt you hope behaves.
Existing APIs, databases, internal tools and MCP servers become steps in that workflow rather than things to replace. We wrote about turning those systems into callable capabilities in From Any Database or API to an MCP Server in Minutes.
The same reasoning applies to the steps themselves. An agent node is the right choice where the path cannot be known in advance, and a function or a single model call is the right choice where it can. We set out how to make that call, step by step, in AI Chatbot vs Autonomous Agent vs Agent Flow vs Multi-State Agent.
This is not another ticketing system
The goal is not to rebuild ServiceNow, Jira, PagerDuty, Datadog, Splunk, Grafana, CloudWatch, your SIEM, Slack or Teams. Those systems do their jobs.
The layer sits between the signals and the decisions. Existing systems produce fragmented signals, the layer turns them into structured incident context, and existing teams work in the systems they already use. It does not need to become the system of record. It needs to make the rest of the stack more intelligent.
The larger pattern: intelligence between systems
Incident management is one instance of a broader shift. Organisations have systems of record, systems of monitoring and systems that do things. What they usually lack is a reasoning layer that works across all three.
That layer connects an alert to a deployment, to a service, to an owner, to a past incident, to a runbook, to a recommended next step.
This is where agentic architecture earns its keep. Not because a model can classify a ticket, but because the system can work out what information it needs, where to get it, how signals relate, which fixed policies apply, and when a person should take over.
One incident inbox. One intelligence layer.
The next incident stack may not need another dashboard. It may need something that understands what the existing dashboards are already saying.
Something that turns eight fragments into one incident, with a likely cause, the affected systems, a recommended severity, a primary owner and a supporting team, the related incidents, the relevant runbook, a confidence level, and a next action.
Monitoring platforms keep monitoring. Ticketing platforms keep tracking. Resolver teams keep control. The layer in between turns fragmented signals into operational context.
The shift is from something broke to here is what likely happened, which signals are connected, how bad it looks, who should look at it, what evidence supports that, and what to do next.