
Every Request Succeeded. Half the Conversations Did Not.
Traditional software monitoring assumes bounded inputs, deterministic execution and loud failures. An agent breaks all three, which is why a dashboard can read 100% success and 273ms at P95 while half of its conversations end incomplete. What the old signals still catch, what they cannot see, and how to score the part they miss.


Key takeaways
- Traditional software monitoring assumes three things: inputs are bounded, execution is deterministic, and failures announce themselves. An agent breaks all three (Table 1).
- The old signals still catch real incidents and should be kept. An hourly error rate climbing to 71 per cent is an incident whatever produced it (Figure 3).
- What they cannot tell you is whether the agent was any good. One panel reads
100.0%success and273msat P95; another, over 2,392 scored conversations, reports 1,189 of them incomplete and satisfaction at 51.3 out of 100 (Figure 6, Figure 7). - Closing that gap means scoring the conversation itself, which means a judge (Figure 9). Treat the judge as code you own and calibrate against human ratings, not as a number handed down.
- The system half of that dashboard exports anywhere. The quality half has gravity (Figure 14): scoring a conversation elsewhere means shipping the conversation elsewhere, then sampling it, which deletes the rare failures worth finding.
The runbook for monitoring traditional software is about forty years old and it is very good. Count the requests. Watch the error rate. Track latency at the tail rather than the mean. Page someone when any of those moves. It has kept sites up for a long time, and most of it carries across to an agent unchanged.
The part that does not carry across is the part that matters most.
Here is the shape of the problem, taken from a live console rather than a thought experiment. One panel reports System Health: Healthy, a success rate of 100.0% and a P95 of 273ms. Another panel, in the same product, reports that of 2,392 scored conversations, 1,189 ended incomplete and 765 ended by creating a support ticket. A derived satisfaction score sits at 51.3 out of 100, labelled Needs work.
Both panels are accurate. They watch different surfaces and answer different questions, and that is exactly the argument: nothing the first panel measures would ever have surfaced what the second one found.
What follows is why that happens, what the traditional signals are still genuinely good for, and what has to sit next to them.
What the old runbook quietly assumes
Traditional software monitoring works as well as it does because the systems it watches are unusually well behaved. Three assumptions hold, and the whole category is built on top of them: Datadog, New Relic, Grafana, and whatever else your on-call rotation currently pages from.
Inputs are bounded. A payments endpoint accepts a schema. You can enumerate the fields, fuzz the edges and write a test per branch. The input space is finite, you have seen most of it before you ship, and whatever you have not seen gets rejected at the door.
Execution is deterministic. The same input takes the same path and produces the same output. That is what makes a green test suite evidence of anything at all, and what makes “steps to reproduce” a reasonable thing to ask for on a bug report.
Failure is loud. When something goes wrong it raises, times out or returns a 5xx. The system announces its own failures. Monitoring’s job is mostly to notice, count and aggregate what has already been announced.
Those three hold for a payments API, an image resizer, a job queue, a cron. They are the reason a dashboard of request counts and latency percentiles is genuinely sufficient for most services.
An agent breaks all three. It breaks the third one in a way that makes the first two expensive.
Three assumptions an agent breaks
| Assumption | An ordinary service | An agent | What it costs you |
|---|---|---|---|
| Inputs are bounded | A typed request body and a finite set of endpoints | Anything a person can type, in any language, at any level of patience | Coverage cannot be established before release, so it has to be measured in production |
| Execution is deterministic | Same input, same path, same output | Same input, a different plan, a different number of tool calls, a different bill | A passing test is one sample. A reproduction may not reproduce |
| Failure is loud | Exceptions, timeouts, 5xx | A fluent, confident, wrong answer returned quickly with HTTP 200 | Nothing in the transport layer is red, so nothing fires |
The input space is the assumption people underestimate. Every schema you have ever shipped was a promise about what you would be sent. A text box makes no such promise. Users arrive with typos, with three questions in one sentence, with the previous answer pasted back in, in a language nobody planned for, and occasionally with a deliberate attempt to talk the thing out of its instructions. You cannot write that test suite because you cannot write that list.
Non-determinism turns cost into a distribution. The same question, asked twice, can take one tool call or five. An average is still worth having, but it stops being a description of what happens and becomes a summary of things that mostly did not.
And then the quiet one. A service that cannot answer says so. An agent that cannot answer answers anyway, in the usual shape, at the usual length, within the usual latency budget.
What a silent failure actually looks like
Here is a real exchange, four turns long. Nothing in it errored. Both replies returned successfully, promptly, and in good English.
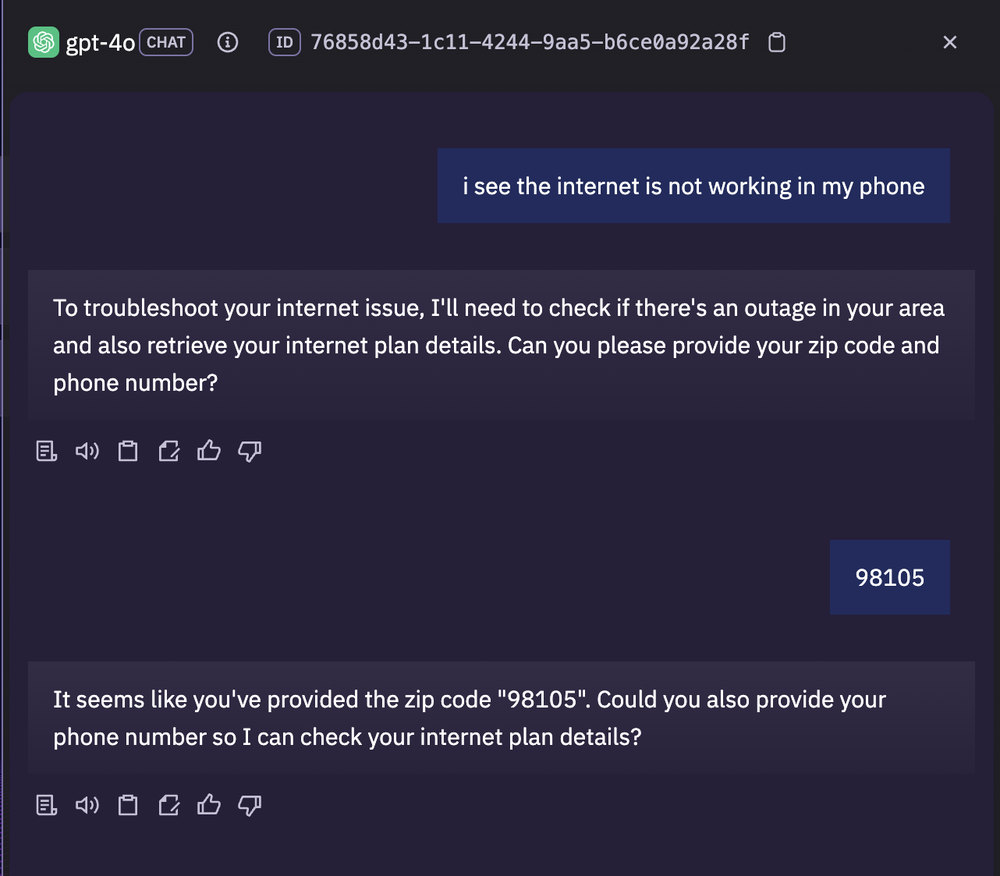
The user says the internet is not working on their phone. The agent, reasonably enough, says it needs two things before it can look: a zip code and a phone number. The user sends the zip code. The agent acknowledges the zip code and asks for the phone number again.
Read that as a request log and it is four successful messages with good latency. Read it as a conversation and it is a two-field form being filled one field at a time, four turns in, by a system that asked for both at once. The agent did not lose the zip code. It simply has not started troubleshooting anything.
This is the class of failure the rest of this article is about, and it has one defining property: the system does not know it happened. There is no exception to catch, no status code to count, no timeout to alert on. Something outside the request path has to read the conversation and form a view.
Note the row of controls under each reply. The last two are a thumbs up and a thumbs down, and they are one of the two ways that view gets formed. We come back to them.
The old signals still catch real things
None of this is an argument against traditional software monitoring. The agent still runs on infrastructure, that infrastructure still fails in ordinary ways, and when it does you want to be told in the ordinary way. Keep whichever of those tools you already run. Nothing later in this article replaces it.

Ignore the numbers for a moment and read the labels: executions, success rate, average duration, P95, P99, max duration. That is the complete list of questions this panel can answer, and it would be the identical list for a payments API or an image resizer. It is a good list. It is also a closed one.
It is not decorative either. Widen the window and the same signals pick up something that genuinely needs attention.

An hourly error rate touching 71 per cent is an incident by any definition, and you do not need a word of natural language to see it. Average duration swinging between near zero and eight seconds over the same period is the same story told from a different angle. Keep this. Alert on it. It will catch the bad deploy, the expired credential and the upstream outage, exactly as it always has.
The claim here is narrower than “traditional software monitoring is obsolete”. The claim is that it is complete for one class of failure and blind to another, and that for agents the second class is the larger one.
The layer above: volume, users and what it costs
The next layer up is still not about quality, but it is where an agent starts to behave differently from a service in a way that shows up on an invoice.
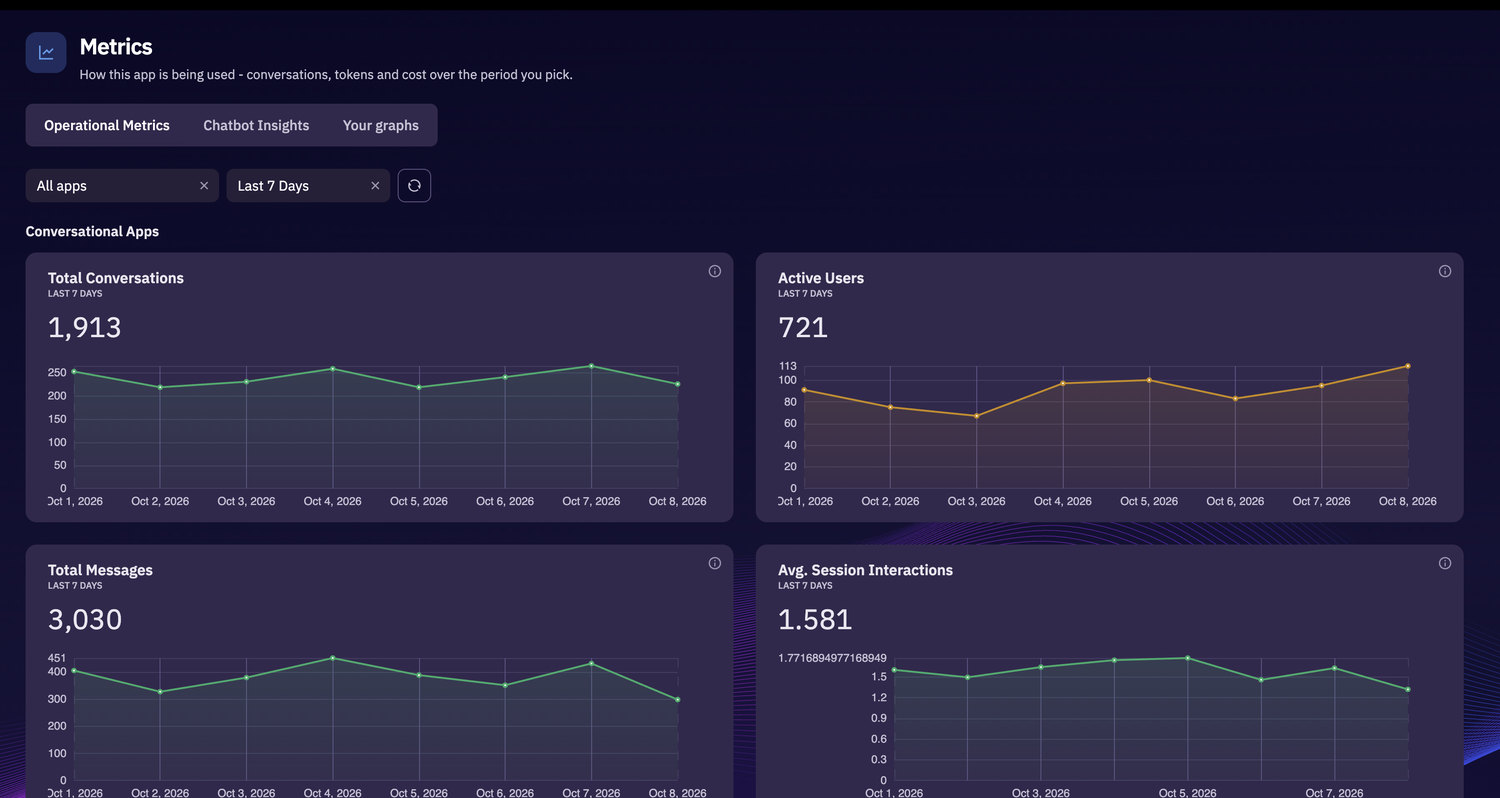
Three of those four are familiar from any product dashboard. The fourth is not.
Average session interactions of 1.581 says that most conversations are a single exchange: one question, one answer, and the user leaves. Whether that is excellent or alarming depends entirely on what the agent is for. For a lookup bot it is the target. For a troubleshooting agent that needs two fields before it can do anything at all (Figure 1) it means most people left before it got started.
No system metric can tell you which of those you are looking at. That is already a quality question wearing an operational costume.
Cost is the other one.

Across the 1,913 conversations in Figure 4 that works out at roughly 14,900 tokens and 2.7 cents each. Useful as a budget line. Nearly useless as a monitor, because the interesting cases are never near the mean.
A retry loop, a tool that starts returning a larger payload than it used to, a prompt that grew by one paragraph: each of those shows up as a slow drift in a number with no natural ceiling, because nothing in the system treats spending more as an error. Cost is one of the few agent signals where the right alert is on the derivative, not the level.
The question none of those panels asks
Everything so far has been about the machine. Here is the same system asked about the work.
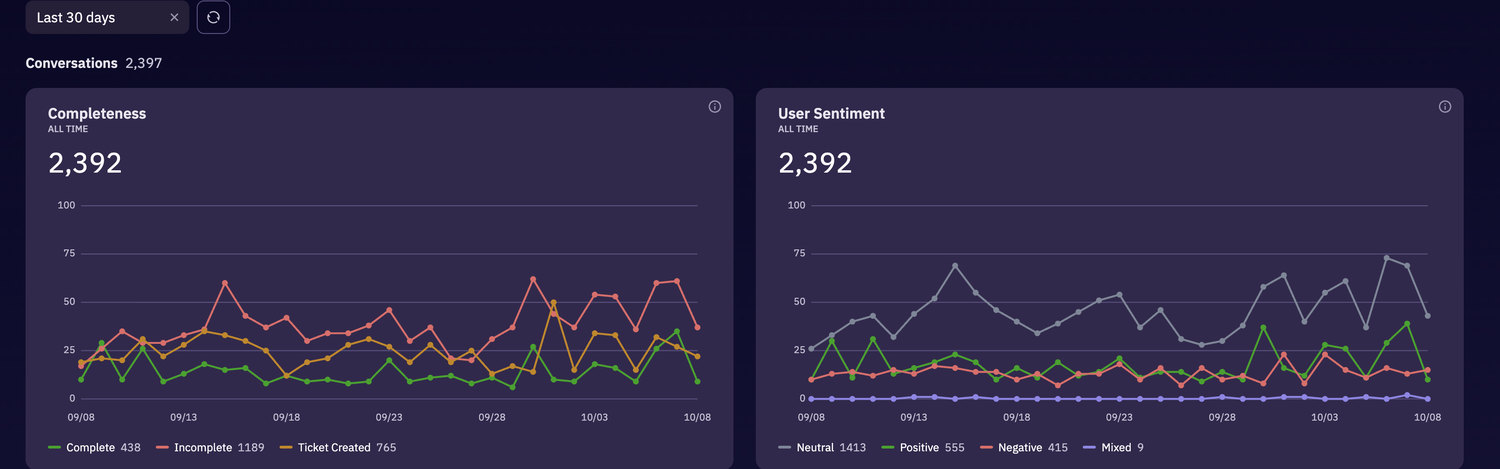
Both charts are scored over the same 2,392 conversations, and in each case the categories partition the whole set rather than overlapping. Which makes the arithmetic on the left uncomfortable:
- Complete: 438. 18 per cent of conversations finished the job.
- Incomplete: 1,189. Half of them did not.
- Ticket created: 765. Another 32 per cent ended by handing the problem to a person.
Sentiment is gentler and less useful on its own. 59 per cent neutral is roughly what you would expect from people transacting with software they did not choose. The 17 per cent negative is the part worth reading, and so is the fact that positive still outnumbers it.
Both charts collapse into one number.
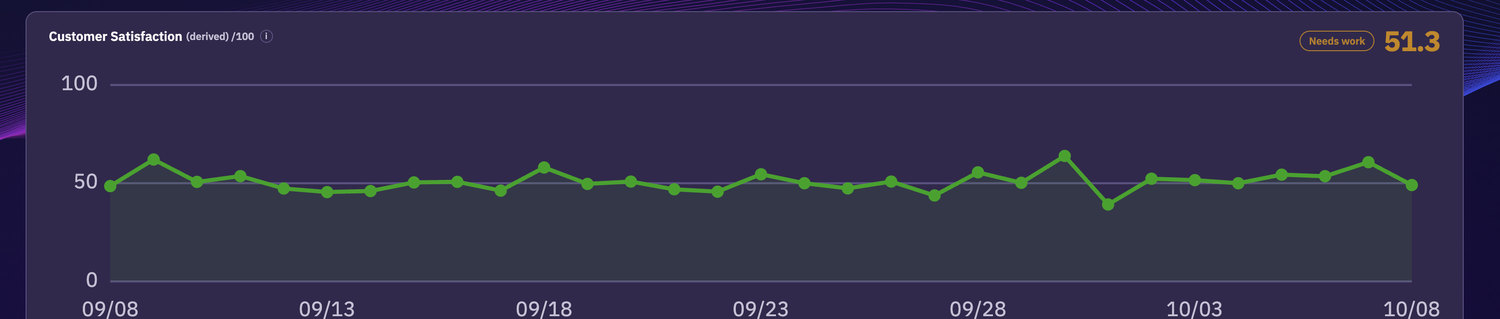
51.3 out of 100, and remarkably stable: a month of daily points sitting between roughly 40 and 62, with no trend in either direction. The stability is its own finding. This is not a regression somebody introduced last Tuesday and nobody noticed. It is the steady state.
These are our own numbers and they are not flattering. They are more useful than a flattering screenshot would be, because the entire point is that a team watching only Figure 2 and Figure 3 would have no idea any of this was true.
Incomplete at what, exactly?
A completeness rate is one number, and one number is where an investigation starts rather than where it ends. The next question is obvious: incomplete at what?
That question is awkward for the reason set out in the first row of Table 1. The input space is unbounded, so there is no list of topics to group by. Nobody wrote one, nobody could have, and any list written in advance would describe what you expected rather than what arrived.
So the list has to be recovered from the traffic afterwards.
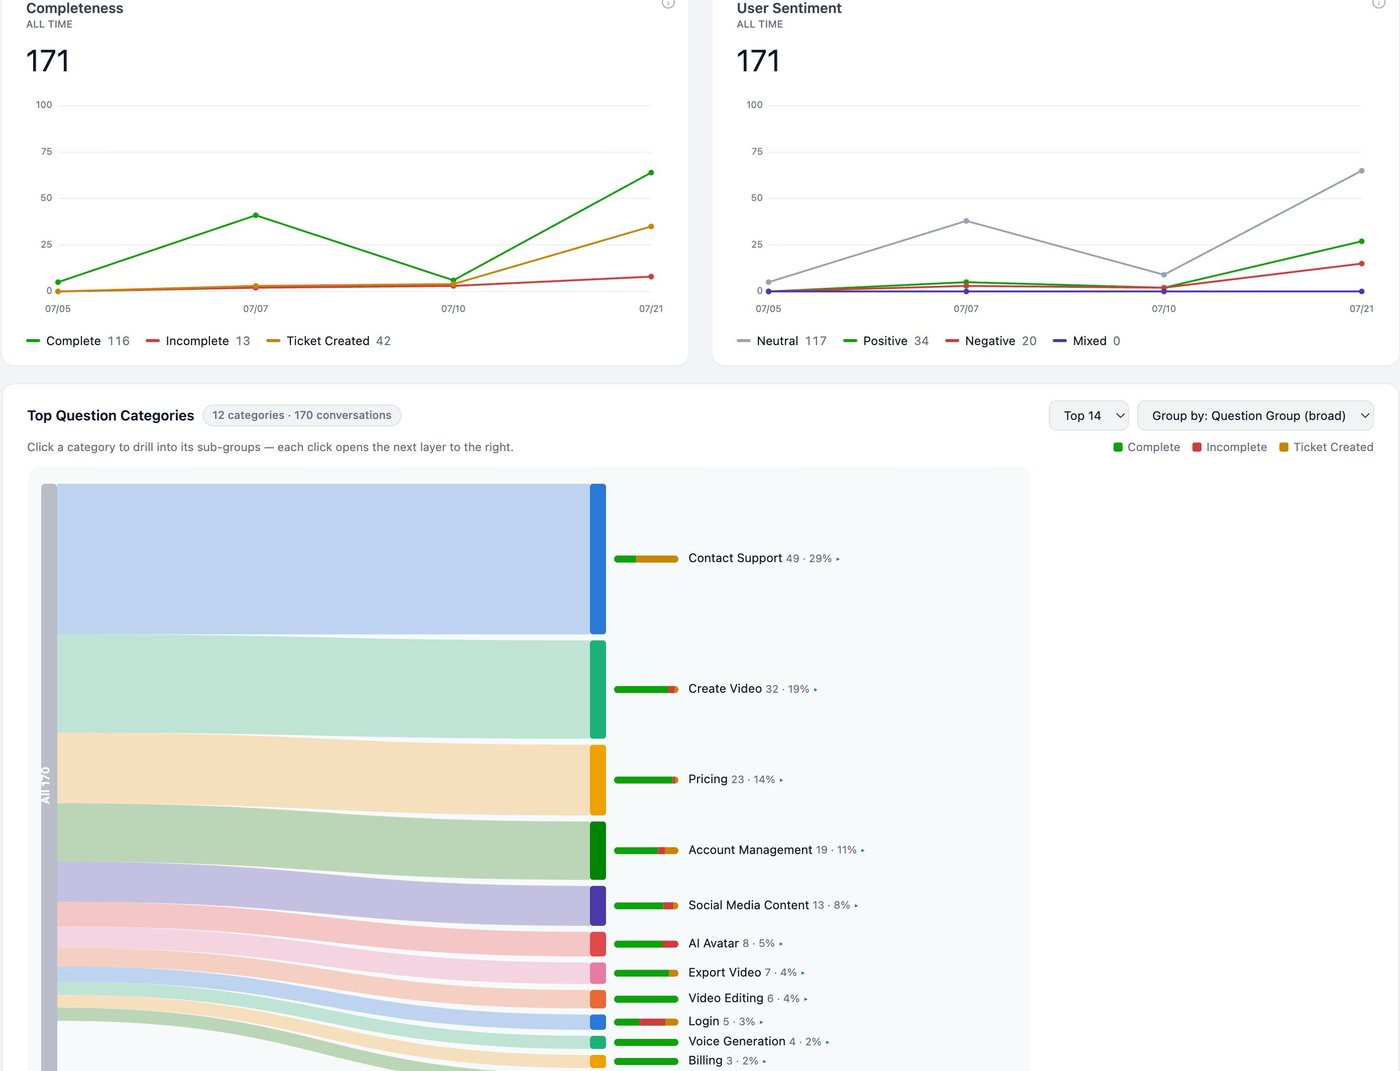
Four categories carry about 72 per cent of this traffic. Contact Support is 29 per cent on its own, then Create Video at 19, Pricing at 14 and Account Management at 11. After that a long tail: Login with five conversations, Voice Generation with four, Billing with three.
That alone answers a question most teams are guessing at, which is what the thing is actually being used for. But the bar beside each label is what turns it from analytics into monitoring, because every category carries its own completeness mix. The single number at the top becomes a ranked list of places to work:
- Contact Support is mostly amber. The largest category by a distance, and most of it ends in a ticket. Look at the aggregate above it: of 42 tickets in the whole window, most sit in this one group. That may be correct behaviour for a support agent or it may be the agent giving up on a third of the traffic, and which one it is is a decision rather than a metric.
- Login is mostly red. Five conversations, so it will never move the headline number, and most of them end incomplete. A small category failing badly is precisely what an aggregate buries.
- Pricing and Video Editing are solid green. Worth knowing before somebody proposes spending a quarter improving them.
Clicking a category opens its sub-groups, one layer at a time. Same movement as everything else here: a number, then a cohort, then a conversation.
Two honest notes. This is a different application and a different window from Figure 6, 171 conversations rather than 2,392, and its profile is far healthier: 116 complete against 13 incomplete. Which is worth saying plainly, because it means completeness is not a benchmark. It is a property of one agent measured against one rubric, and the only number that tells you anything about your agent is your own.
And the categories are model output too. They are a reading of the traffic rather than a schema, so names can shift and the boundaries are judgement calls. Use the panel to decide where to look next. Do not wire anything to it that needs a stable key.
How a conversation becomes a number
Every number in the last two sections is model output. The completeness rate, the sentiment split, the satisfaction score, and the categories the traffic was sorted into: a model produced all of it. How it gets produced is therefore not an implementation detail. It is the entire basis for trusting any of it.
The raw material is a transcript: unstructured, variable-length, free text. The dashboard needs fields it can count. Something has to read the one and emit the other.
Put that way, it is the unstructured-to-structured problem again, and the document being parsed happens to be a chat log. The judge runs as a multi-step agent, the extraction step emits defined fields, and the aggregate panels in Figure 6 are ordinary queries over those fields.
Two properties of that pipeline matter more than the rest. Scoring runs automatically, which is what makes 2,392 conversations tractable at all. And the criteria are editable, which is the part to insist on, for a reason that becomes obvious the first time you disagree with a score.
Your judge should be a workflow you can read
Every platform that scores agent quality has a judge inside it somewhere. The difference that matters is whether you can open it.
Here is one opened. This particular extractor is configured for insurance claims rather than conversation quality, which makes it a better illustration than the judge itself: same node type, same job, different document.
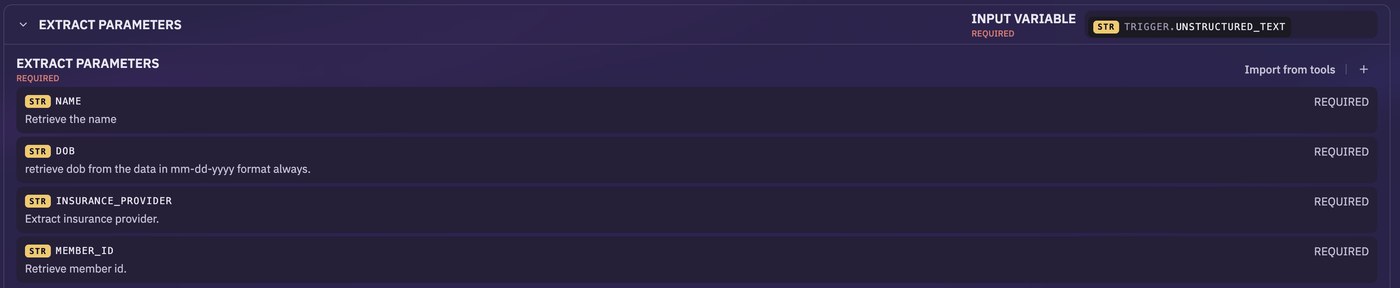
An input variable goes in. A list of fields comes out, each one named, typed, marked required or not, and carrying its own instruction. retrieve dob from the data in mm-dd-yyyy format always is not code and it is not a hidden system prompt. It is the specification, sitting in a box you can edit.
Point the same kind of node at a transcript instead of a claim form, swap MEMBER_ID for a completeness field and INSURANCE_PROVIDER for a sentiment one, and the instruction attached to each field becomes your rubric. That is the shape of what produces the fields counted in Figure 6.
“Complete” is not a universal property of a conversation. For a support agent it might mean the question was answered without a handoff. For a sales agent it might mean a meeting was booked, and a polite, helpful, entirely unproductive exchange should score zero. For a triage agent, creating a ticket is the successful outcome, and the 765 tickets in Figure 6 belong in a different column of that chart.
If the judge is a closed feature, your only move when you disagree with it is to file a feature request. If the judge is a workflow assembled from the same steps you already build with, three things become possible:
- You can read the rubric. A score you cannot explain to a stakeholder is a score you will quietly stop quoting after the first time it is challenged.
- You can change it. Redefining completeness for your domain becomes editing a prompt and a schema rather than waiting on somebody else’s roadmap.
- You can version it. And you have to, because a score only means anything relative to the rubric that produced it. Changing the rubric and then comparing across the change is the easiest way in this whole discipline to produce a confident, wrong trend line.
The caveat belongs in the body of the article rather than a footnote, because it is load-bearing. A judge is a model, and everything said above about models applies to it. It is non-deterministic. It will drift when the model underneath it is upgraded. It has the same failure mode as the agent it grades: fluent and wrong.
A judge is a measuring instrument built out of the material it is measuring. That is an unusual position to be in, and there is only one defence.
What calibrates the judge is a person
Which brings the thumbs back.
Under every reply in Figure 1 there is a row of controls, and the last two are a thumbs up and a thumbs down. That is the cheapest honest signal in the system: a human who was actually there, saying whether it helped.
Those ratings surface alongside everything else at the conversation level.
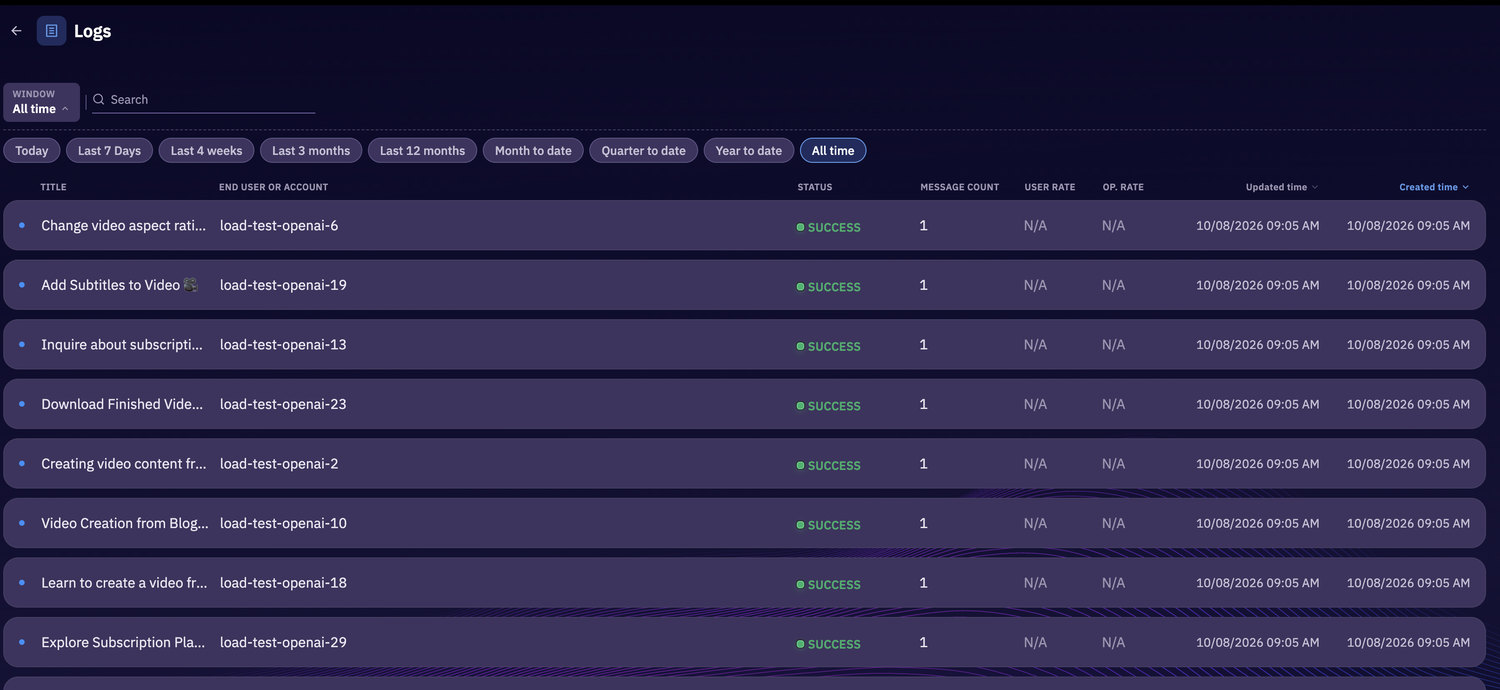
Two things in that table are worth noticing, one by its presence and one by its absence.
Every row says SUCCESS. That is the traditional column doing its traditional job, correctly. It will go on saying SUCCESS through every failure described in this article.
Both rating columns read N/A. USER RATE is the end user’s rating and OP. RATE is an operator’s; these particular rows are synthetic load-test traffic that nobody rated. That is the normal condition rather than a bug. Human ratings are sparse by nature, because most people never press either button.
Sparse is fine. Sparse is not the same as useless. A hundred rated conversations is enough to ask the one question that validates a judge:
Agreement on that sample is what licenses you to trust the judge on the 2,392 nobody rated. Divergence is the signal to go and edit the rubric. This is the metric teams reach for last and should reach for first, because without it every quality number on the dashboard is a model’s unverified opinion.
It is cheaper than it sounds, because you are estimating one proportion rather than grading everything. The sample size follows from the precision you want, not from how much traffic you have.
| Precision you want | Rated conversations needed | Share of a 2,392-conversation month |
|---|---|---|
| Within 10 points | About 100 | 4% |
| Within 5 points | About 385 | 16% |
| Within 3 points | About 1,070 | 45% |
The shape of that table is the argument for doing it at all. Going from no idea whatsoever to knowing the agreement rate within ten points costs about a hundred conversations, one in twenty-five of a month like Figure 6. Halving the error after that costs four times as much, and halving it again costs nearly half the month. Start at a hundred and stop there unless somebody is arguing with the number.
Three rules make it mean something:
- Sample at random, not by complaint. Reviewing only the conversations somebody escalated measures the judge on cases it has already failed, which says nothing about the rest.
- Rate the conversation, not the reply. The failure in Figure 1 is invisible in any single message and obvious across four.
- Re-measure after every rubric change and every model upgrade. Both void the previous agreement number, and the second will happen whether or not you asked for it.
The two rating columns exist separately for a reason worth keeping. An end user rates whether they felt helped. An operator reading the transcript afterwards rates whether the agent did the right thing. Those two disagree more often than is comfortable, and the disagreement is the interesting part: a user who was given a confident, wrong answer will frequently rate it up.
From an aggregate back to one conversation
Naming the category narrows the search. It does not finish it. Login conversations end incomplete is a cohort, not a cause, and the cause is always sitting in a particular conversation.
So the path from a cohort down to one run has to be short, or nobody walks it twice.
Most of the middle of that is visible in Figure 11: the window selector running from today out to all time, the free-text search across transcripts, the status and rating columns to sort by.
Free-text search is the step people skip and the one that pays. “Incomplete” is a category, and a category of 1,189 is a statistic. Every incomplete conversation that mentions refund is a bug report with a reproduction attached.
The last two steps, reading a run back to the tool call that actually produced the answer, are a subject of their own, and we have written them up separately in the agent said the data was complete, and the tool call said otherwise.
Replay, and what it can and cannot prove
Once you are inside a single execution there is one more affordance worth understanding precisely, because it is easy to over-trust.
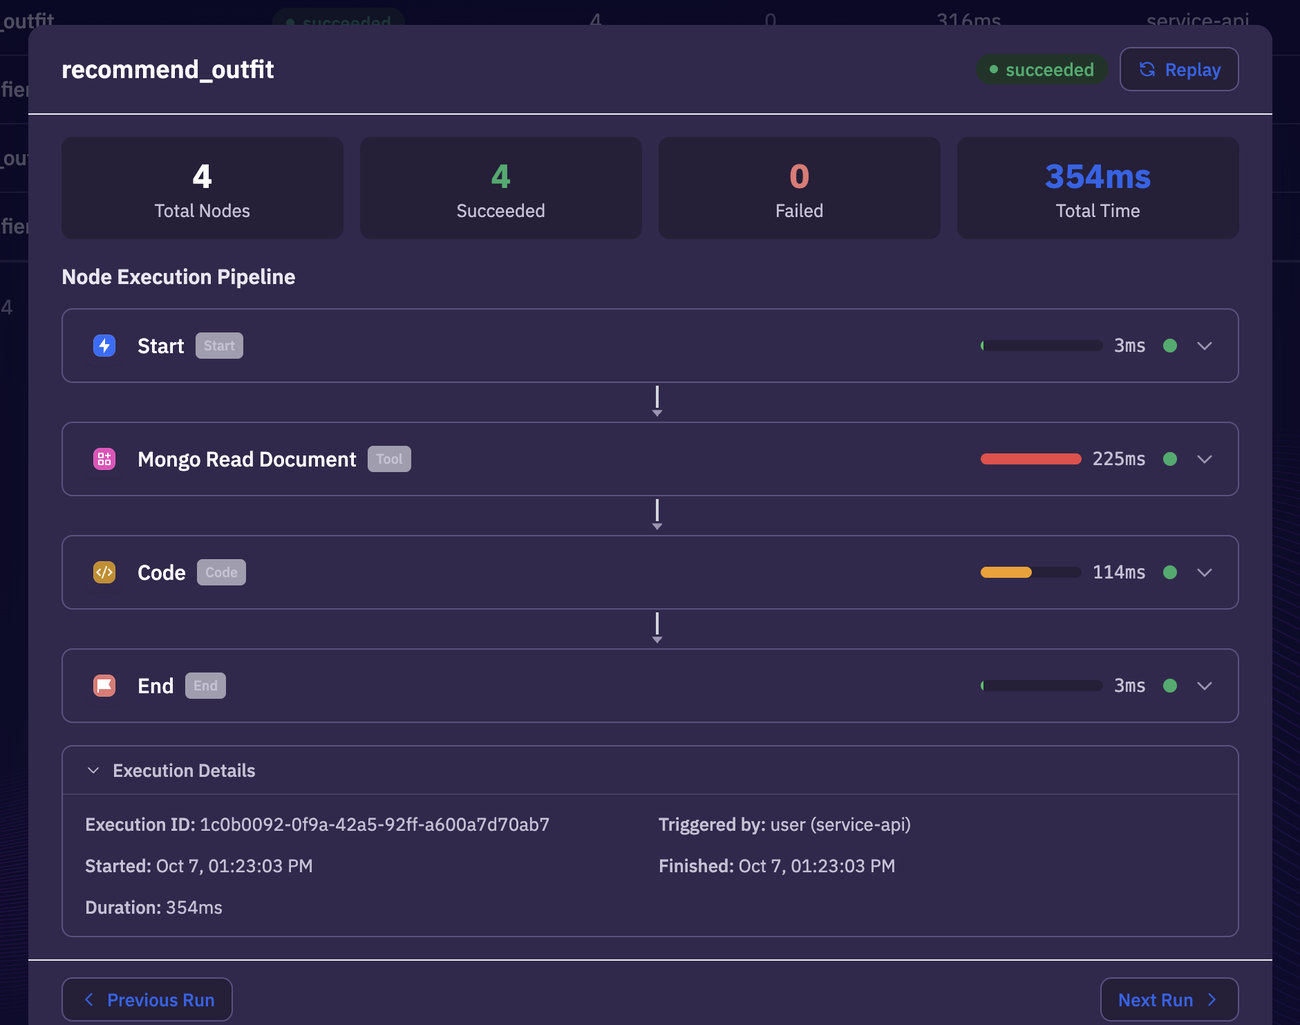
Four nodes, all green, 354 milliseconds end to end. The Mongo read took 225ms of that and the code step 114ms, which accounts for the entire run in two steps. The red bar beside the Mongo read is relative duration, not an error state. This is latency attribution, and it is the one place in this whole article where the traditional software monitoring model fits an agent perfectly.
The button in the corner re-executes the run with the same input.
That is genuinely useful, and it is worth being exact about what it buys, because the second assumption in Table 1 has not gone anywhere. Replay fixes the input. It does not fix the path.
- For a deterministic workflow, same input and same code means same result. A replay that now succeeds is real evidence that something underneath it was fixed.
- For a run with a model in it, a replay that succeeds tells you the failure is not guaranteed. It does not tell you it is gone.
Used as a probe, replay is excellent: change one thing, replay, watch what moves. Used as a proof, it is a single sample drawn from a distribution. The honest way to establish that a fix worked is to replay a set of failing cases and compare the rates, not to replay one and declare victory.
What to actually put on the dashboard
Pulling the two halves together. The top of this table is the old runbook, and it still works. The rest is what had to be added.
| Signal | The question it answers | Where it comes from | Alert on it? |
|---|---|---|---|
| Error rate, P95, P99 | Is the machinery working | Execution records | Yes, on a threshold |
| Throughput and active users | Is anyone using it | Conversation records | Yes, on a sharp drop |
| Tokens and cost per conversation | Is it getting more expensive to answer the same question | Per-run token accounting | Yes, on drift rather than on a level |
| Interactions per session | Are people finishing, or giving up | Conversation records | Yes, on movement in either direction |
| Completeness rate | Did the agent finish the job | Judge workflow | Yes. This is the one |
| Handoff or ticket rate | How often it gave up and called a human | Judge workflow | Yes, unless handing off is the job |
| User sentiment | How it felt to the person on the other end | Judge workflow | As a trend, not a threshold |
| Derived satisfaction | One number for a stakeholder | A composite of the rows above | No. Use it to start investigations, never to end one |
| Thumbs up and down | What a human who was there thought | The end user | No, but read every thumbs down |
| Question category mix | What people actually ask, and which topics fail | Clustering over transcripts | Yes, when a new category appears |
| Judge against human agreement | Can you trust the four rows above this one | Rated conversations | Yes, and this is the one everybody forgets |
The first three rows are what Datadog and New Relic were built for, and there is no reason to move them anywhere. The rest have nowhere to live in those tools, because the thing being measured is not a request.
The last row is the one most teams discover late. Every quality signal on that list is produced by a model. A monitoring system whose instruments are never calibrated is a monitoring system that will eventually tell you something comforting and false.
Where all of that has to live
Table 3 has a column most readers skim: where each signal comes from. It is worth not skimming, because the eleven rows do not come from one place, and the two halves behave very differently the moment you try to move them somewhere else.
Exports cleanly
- Error rate
- P95 and P99
- Throughput
- Active users
- Tokens and cost
Has to carry the transcript
- Completeness
- Sentiment
- Satisfaction
- Category mix
- Judge agreement
The left lane bolts on to anything. It is metrics and spans, it is what OpenTelemetry and the vendors around it were built for, and nothing in this article argues against shipping it wherever you already ship such things.
The right lane is where a second system starts to cost you, and the reason is specific.
That one sentence has three consequences, and the third is the expensive one.
Volume. Figure 5 is 28,522k tokens in a week. That is payload, not metadata. Observability pricing is built around spans, metrics and indexed fields; full conversation bodies are a different order of magnitude and a different line on the invoice.
Privacy. The transcript is the most sensitive thing the system holds, because it is whatever your customer chose to type. Sending it to a second vendor is a data residency and processing agreement conversation, not a configuration change. In a regulated industry that is where the discussion ends.
And so you sample. Which is the real cost, because sampling is built to keep the common case and drop the tail. Look at Figure 8 again. Login is five conversations out of 170 and most of them end incomplete. At ten per cent sampling that category is zero or one conversation, which is to say it does not exist. The failures worth finding are concentrated in exactly the rows sampling deletes.
The second cost is that the chain breaks at the seam. Figure 12 is six steps from a dashboard down to a tool call, and every step is a join: a score to a window, a window to a cohort, a cohort to a conversation, a conversation to a run, a run to a step. When the first few live in one product and the rest in another, those joins become identifiers two systems have to agree about, across two retention policies and two clocks. Any one of them drifting turns a four-second investigation into a twenty-minute one, and a twenty-minute investigation is one nobody repeats.
The third is the hardest to fix, because it is not about plumbing. The judge ends up in the wrong place.
A monitoring product receives transcripts. That is enough for sentiment, and enough for a reading of completeness. It is not always enough for the truth.
Take the support agent in Figure 8, where most of Contact Support ends in a ticket. Whether that counts as success depends on something the transcript does not contain: whether the ticket was ever resolved. Answering that is a tool call against the ticketing system. A judge that lives where the agent lives can make it, because it has the same tools the agent had. A judge that only receives transcripts cannot, and will score the conversation on how it read rather than on how it ended.
None of which makes a separate product wrong. There are two cases where it is plainly right:
- You run agents in more than one place. Three stacks and one neutral layer beats three dashboards, and that is worth paying the export cost for.
- You have already standardised. If everything you own emits OpenTelemetry, one more emitter costs close to nothing, at least for the left-hand lane.
The claim is narrower than “do not use a second tool”. It is that the left lane is portable and the right lane has gravity: it needs the transcripts, the run and the tools, all three at once. Wherever those already sit together is the cheapest place for it to live. If that happens to be the platform running the agent, there is nothing to instrument, because the record was already being kept.
What this does not do
Four limits, stated plainly, so nobody designs around a capability that is not there.
- There is no built-in annotation queue.
USER RATEandOP. RATEare columns you can sort and filter. Routing a sample of conversations to a reviewer on a schedule, tracking who rated what, measuring agreement between raters: that is a process you would build around the data, not a screen you open. - Scores are not a release gate. Nothing here blocks a deployment because completeness fell. The numbers are observed, not enforced. Turning them into a gate means running the judge yourself over a fixed set of cases and comparing versions before you ship.
- The session view is narrower than its name suggests. It covers voice calls. Text conversations live in the logs view in Figure 11, which is a different surface with different columns.
- An aggregate never tells you why. Every number in this article is a prompt to go and read something. The panels narrow the search. They do not conclude it.
There is a fifth and more general one. A conversation score tells you about the conversation, not about the outcome. Whether the customer’s internet actually started working, whether the meeting that got booked was attended, whether the ticket that was created was ever resolved: those facts live in the systems the agent talked to. Joining them back to the transcript is the next problem, not a solved one.
What to take from this
Monitoring an agent is not traditional software monitoring with extra charts bolted on. It is two monitors running side by side, asking different questions, and the older one cannot be taught to ask the newer one.
- Keep the old runbook. Error rate, latency percentiles and throughput still catch the bad deploy and the upstream outage, and nothing in the quality layer will. An hourly error rate of 71 per cent is an incident whatever produced it.
- Assume the failures are silent. The expensive ones return HTTP 200 inside the latency budget. If your alerting strategy is “we will hear about it”, you will, from the customer.
- Score the conversation, and own the scorer. Completeness is domain-specific. A judge you cannot open is a number you cannot defend, and the first stakeholder who challenges it will be the last person who quotes it.
- Calibrate against humans, cheaply. You do not need many rated conversations. You need enough to check that the judge and a person agree about which ones were bad.
- Keep the quality half where the transcripts, the runs and the tools already are. Scoring travels badly. The signals that export cleanly are the ones you already knew how to collect.
- Make the path from a number to a transcript short. Filter, search, open the conversation, open the run. Any friction in that chain and the dashboard becomes decoration.
The uncomfortable version of all of this is that the dashboard which says your agent is fine and the dashboard which says it is not can both be correct, and only one of them is the one your users are living in.
If you want to see this against your own traffic, the monitoring in these screenshots is part of the same platform that runs the agents, so there is nothing to instrument and no agent to install. Observability is where the runs are. Start free with $10 in credit and look at the number you have not been shown yet.